Market Outlook
October 23, 2017
Market Cues
Domestic Indices
Chg (%)
(Pts)
(Close)
Indian markets are likely to open flat tracking global indices and SGX Nifty.
BSE Sensex
(0.6)
(194)
32,390
U.S. stocks extended gains Friday, with major indexes closing at records, after the
Nifty
(0.6)
(64)
10,146
Senate passed a budget blueprint for the next fiscal year, paving the way for the tax
Mid Cap
0.0
1
16,116
cuts some investors believe is vital to keeping the bull market alive. The Dow Jones
Small Cap
(0.0)
(3)
17,063
Industrial Average DJIA, rallies 0.7%, to 23,329, for a weekly gain of 2%. The S&P
500 SPX gained 0.5%, to close at 2,575, rising 0.9% for the week. The Nasdaq
Bankex
(1.8)
(495)
27,187
Composite COMP rose 0.4%, to end at 6,629, adding 0.4% on the week.
Global Indices
Chg (%)
(Pts)
(Close)
U.K. stocks significantly trimmed their gains and closed only marginally higher on
Friday, weighed by a rise in the pound after a more positive tone came out of the EU
Dow Jones
0.7
166
23,329
summit in Brussels, seen as moving Brexit talks along. The FTSE 100 index UKX,
Nasdaq
0.4
24
6,629
ended 0.19 points higher at 7,523.
FTSE
0.0
0
7,523
Samvat 2074 began on a tepid note on Thursday as losses in the banking sector
Nikkei
0.9
201
21,658
pulled benchmark indexes Sensex and Nifty lower in a special Muharat trading
Hang Seng
(0.4)
(124)
28,363
session held on the auspicious occasion of Diwali. The 30-share Sensex gave up
Shanghai Com
0.1
2
3,381
early gains to end down 0.60 percent at 32,390 while the 50-share Nifty index fell
0.63 percent to finish below the 10,150-mark in the special one-hour session.
Advances / Declines
BSE
NSE
News Analysis
Advances
1,597
902
JSW, Tata Steel, Vedanta eye Bhushan Power
Declines
911
724
Unchanged
93
68
Detailed analysis on Pg2
Investor’s Ready Reckoner
Volumes (` Cr)
Key Domestic & Global Indicators
BSE
933
Stock Watch: Latest investment recommendations on 150+ stocks
NSE
5,744
Refer Pg5 onwards
Net Inflows (` Cr)
Net
Mtd
Ytd
Top Picks
CMP
Target
Upside
FII
(252)
(4,486)
32,044
Company
Sector
Rating
(`)
(`)
(%)
MFs
947
6,413
92,756
Blue Star
Capital Goods Accumulate
799
867
8.5
Dewan Housing Finance
Financials
Accumulate
603
670
11.2
Asian Granito
Other
Accumulate
504
570
13.2
Top Gainers
Price (`)
Chg (%)
Navkar Corporation
Other
Buy
194
265
36.4
Gmdcltd
156
6.3
KEI Industries
Capital Goods
Buy
323
380
17.7
Bomdyeing
207
5.0
More Top Picks on Pg4
Ghcl
260
5.0
Key Upcoming Events
Igl
1,573
5.0
Previous
Consensus
Date
Region
Event Description
Bbtc
1,726
4.8
Reading
Expectations
Oct 23
US
Existing home sales
5.35
5.30
Oct 24
Germany PMI Manufacturing
60.60
Top Losers
Price (`)
Chg (%)
Oct 24
Germany PMI Services
55.60
Axisbank
464
(9.5)
Oct 25
UK
GDP (YoY)
1.50
1.50
Religare
44
(8.2)
Oct 25
US
New home sales
560.00
550.00
Denabank
28
(5.8)
More Events on Pg7
Crisil
1,795
(4.0)
Icicibank
263
(4.0)
As on October, 18 2017
Market Outlook
October 23, 2017
News Analysis
JSW, Tata Steel, Vedanta eye Bhushan Power
JSW Steel, Tata Steel and Vedanta are among the seven companies that have
expressed interest in Bhushan Power & Steel, undergoing the Reserve Bank of India
(RBI)-mandated insolvency process.
Apart from the three companies, a private equity player, an investor from the
UAE, a mid-sized domestic steel company and the existing promoter, Sanjay
Singal, have also submitted EOIs (expressions of interest).
Bhushan Power & Steel was on the list of 12 large non-performing accounts that
the RBI had recommended for insolvency proceedings under the Insolvency and
Bankruptcy Code (IBC). The other steel companies were Essar Steel, Bhushan Steel,
Electrosteel Steels and Monnet Ispat & Energy.
The unlisted Bhushan Power & Steel has a steel-making capacity of three million
tonnes across Odisha, West Bengal and Chandigarh. A hot-rolled steel facility is in
Odisha and cold-rolling facilities are in Kolkata and Chandigarh. Bhushan also
has a captive power plant, a pellet plant and an iron ore beneficiation plant.
Bhushan’s debt in FY16 stood at `37,248.26cr, net sales were at `7,699.8cr and
losses were at `2,435.95cr.
Economic and Political News
GST rate structure needs rejig, says Hasmukh Adhia
IGST refunds for exporters start, but at a slow pace
Cut in deposit rates drives investors to MFs
EPFO to consider crediting ETF units to PF accounts
Corporate News
Axis Hero MotoCorp sells over 3 lakh units on Dhanteras
Dr Reddy’s Labs: U.S. appeals court ruled that NuvaRing’s patent is valid
Indian Energy Exchange to start trading on BSE/NSE
GMR Infra: GMR Hyderabad International Airport Ltd. to issue and allot
$350 million of 4.25 senior secured fixed rate notes of 10-year tenure
Market Outlook
October 23, 2017
Quarterly Bloomberg Brokers Consensus Estimate
Havells India Ltd - Oct 23, 2017
Particulars ( ` cr)
2QFY18E
2QFY17
y-o-y (%)
1QFY18
q-o-q (%)
Sales
1,960
1,452
35.1
1,860
5.4
EBIDTA
217
210
3.4
172
26.2
%
11.1
14.5
9.3
PAT
143
145
(1.4)
121
18.2
IndiaBulls Housing Finance - Oct 23, 2017
Particulars ( `cr)
2QFY18E
2QFY17
y-o-y (%)
1QFY18
q-o-q (%)
PAT
833
641
30.1
734
13.5
Infosys Ltd - Oct 24, 2017
Particulars ( ` cr)
2QFY18E
2QFY17
y-o-y (%)
1QFY18
q-o-q (%)
Sales
17,644
17,310
1.9
17,078
3.3
EBIDTA
4600
4,730
(2.8)
4,490
2.4
%
26.1
27.4
26.3
PAT
3530
3,606
(2.1)
3,483
1.4
Market Outlook
October 23, 2017
Top Picks ★★★★★
Market Cap
CMP
Target
Upside
Company
Rationale
(` Cr)
(`)
(`)
(%)
Strong growth in domestic business due to its leade`hip
in acute therapeutic segment. Alkem expects to launch
Alkem Laboratories
21,856
1,828
2,079
13.7
more products in USA, which bodes for its international
business.
We expect the company would report strong profitability
Asian Granito
1,515
504
570
13.2
owing to better product mix, higher B2C sales and
amalgamation synergy.
Favorable outlook for the AC industry to augur well for
Cooling products business which is out pacing the
Blue Star
7,649
799
867
8.5
market growth. EMPPAC division's profitability to
improve once operating environment turns around.
With a focus on the low and medium income (LMI)
consumer segment, the company has increased its
Dewan Housing Finance
18,891
603
670
11.2
presence in tier-II & III cities where the growth
opportunity is immense.
Loan growth is likely to pick up after a sluggish FY17.
Lower credit cost will help in strong bottom-line growth.
Karur Vysya Bank
7,515
124
180
44.8
Increasing share of CASA will help in NIM
improvement.
High order book execution in EPC segment, rising B2C
KEI Industries
2,512
323
380
17.7
sales and higher exports to boost the revenues and
profitability
Expected to benefit from the lower capex requirement
Music Broadcast
2,195
385
434
12.8
and 15 year long radio broadcast licensing.
Massive capacity expansion along with rail advantage
Navkar Corporation
2,771
194
265
36.4
at ICD as well CFS augur well for the company
Strong brands and distribution network would boost
Siyaram Silk Mills
2,516
2,685
2,856
6.4
growth going ahead. Stock currently trades at an
inexpensive valuation.
Market leaderhip in Hindi news genre and no.
2
viewe`hip ranking in English news genre, exit from the
TV Today Network
2,102
352
435
23.4
radio business, and anticipated growth in ad spends by
corporates to benefit the stock.
After GST, the company is expected to see higher
volumes along with improving product mix. The Gujarat
Maruti Suzuki
2,35,308
7,790
8,658
11.1
plant will also enable higher operating leverage which
will be margin accretive.
We expect loan book to grow at 24.3% over next two
GIC Housing
2,722
506
655
29.6
year; change in borrowing mix will help in NIM
improvement..
Source: Company, Angel Research
Market Outlook
October 23, 2017
Key Upcoming Events
Global economic events release calendar
Bloomberg Data
Date
Time Country
Event Description
Unit
Period
Last Reported
Estimated
Oct 23, 2017
7:30 PMUS
Existing home sales
Million
Sep
5.35
5.30
Oct 24, 2017
1:00 PMGermany
PMI Manufacturing
Value
Oct P
60.60
1:00 PMGermany
PMI Services
Value
Oct P
55.60
Oct 25, 2017
2:00 PMUK
GDP (YoY)
% Change
3Q A
1.50
1.50
7:30 PMUS
New home sales
Thousands
Sep
560.00
550.00
Oct 26, 2017
5:15 PMEuro Zone
ECB announces interest rates
%
Oct 26
-
Oct 27, 2017
6:00 PMUS
GDP Qoq (Annualised)
% Change
3Q A
3.10
2.50
Oct 31, 2017
6:30 AMChina
PMI Manufacturing
Value
Oct
52.40
7:30 PMUS
Consumer Confidence
S.A./ 1985=100
Oct
119.80
120.00
3:30 PMEuro Zone
Euro-Zone GDP s.a. (QoQ)
% Change
3Q A
0.70
Nov 01, 2017
11:30 PMUS
FOMC rate decision
%
Nov 1
1.25
1.25
3:00 PMUK
PMI Manufacturing
Value
Oct
55.90
Nov 02, 2017
2:25 PMGermany
Unemployment change (000's)
Thousands
Oct
(22.00)
5:30 PMUK
BOE Announces rates
% Ratio
Nov 2
0.25
0.50
Nov 03, 2017
6:00 PMUS
Change in Nonfarm payrolls
Thousands
Oct
(33.00)
300.00
6:00 PMUS
Unnemployment rate
%
Oct
4.20
4.20
Nov 08, 2017
China
Exports YoY%
% Change
Oct
8.10
Nov 09, 2017
7:00 AMChina
Consumer Price Index (YoY)
% Change
Oct
1.60
3:00 PMUK
Industrial Production (YoY)
% Change
Sep
1.60
Nov 10, 2017
India
Imports YoY%
% Change
Oct
18.09
5:30 PMIndia
Industrial Production YoY
% Change
Sep
4.30
3:00 PMUK
CPI (YoY)
% Change
Oct
3.00
Nov 14, 2017
12:00 PMIndia
Monthly Wholesale Prices YoY%
% Change
Oct
2.60
India
Exports YoY%
% Change
Oct
25.67
Source: Bloomberg, Angel Research
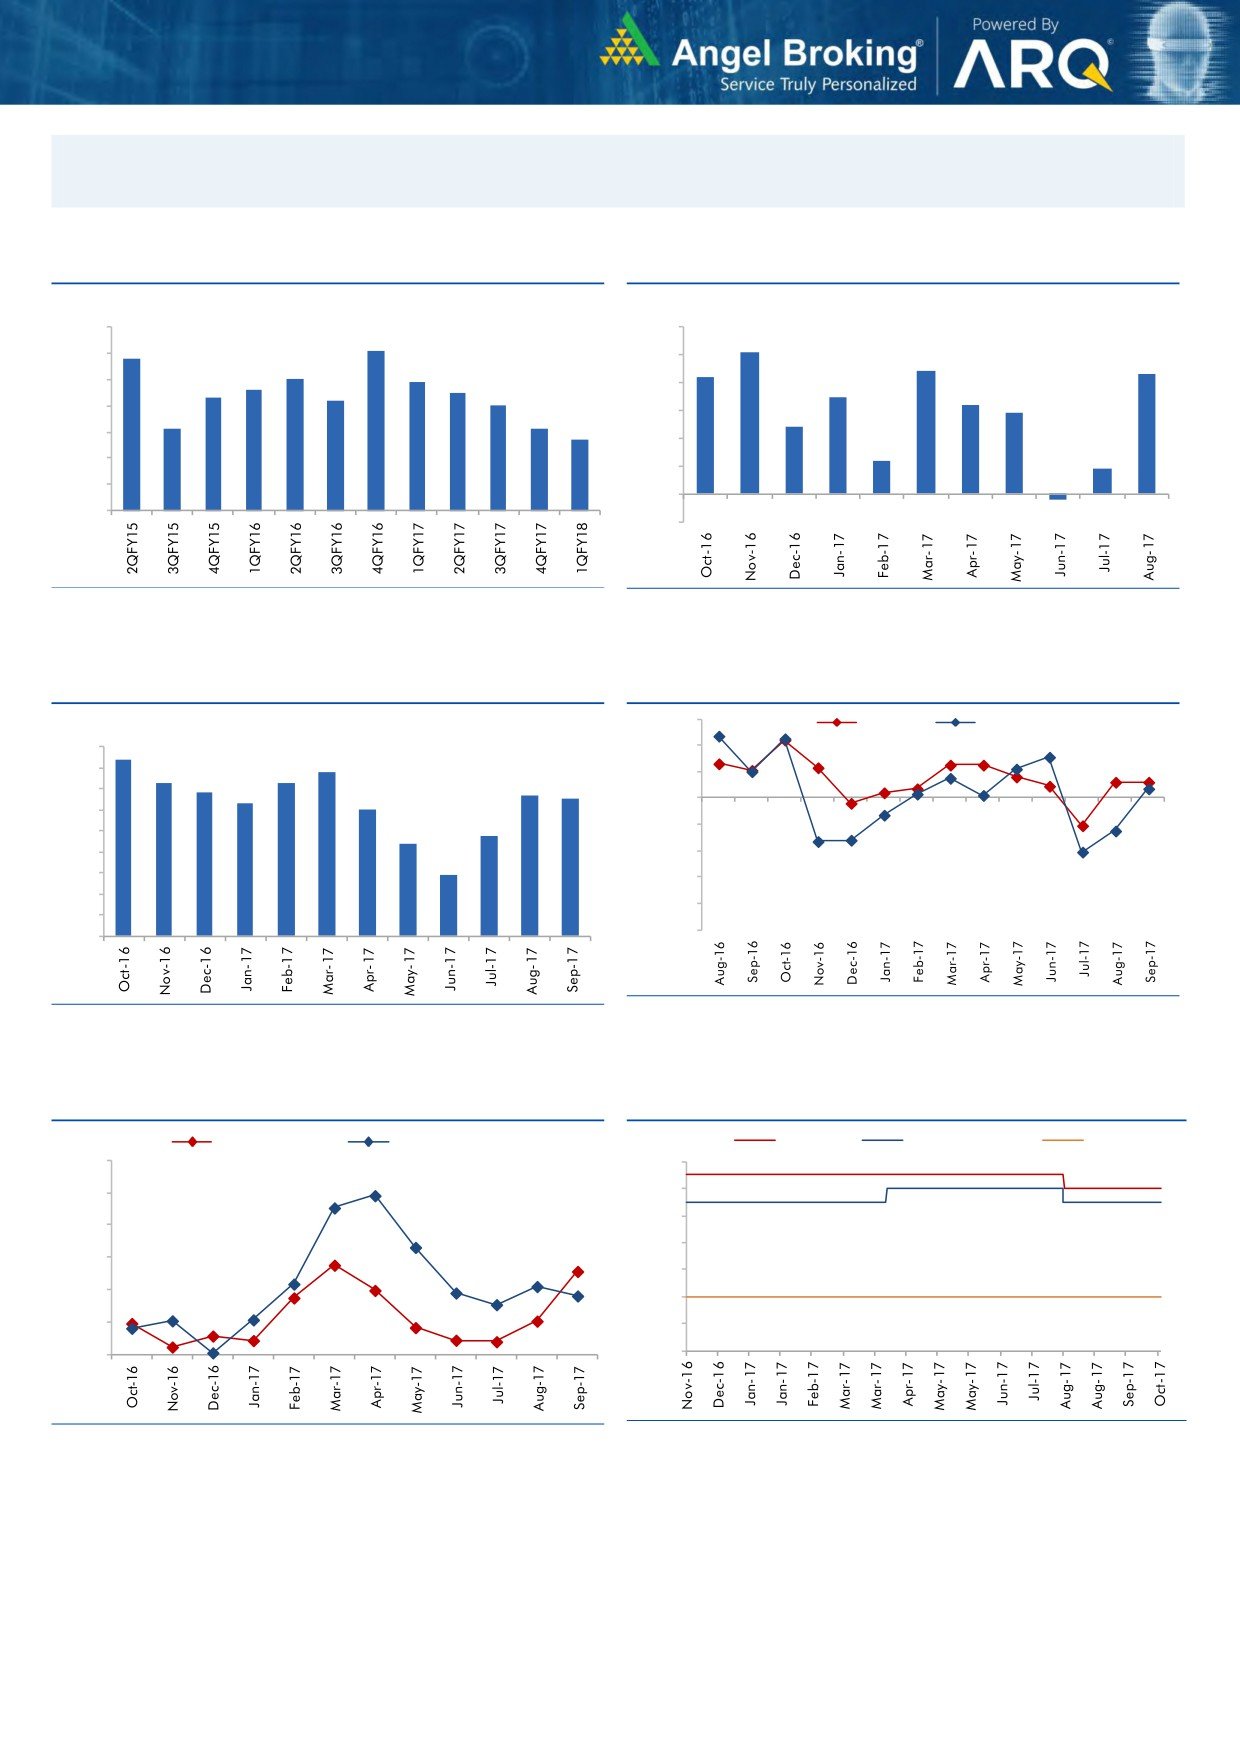
Market Outlook
October 23, 2017
Macro watch
Exhibit 1: Quarterly GDP trends
Exhibit 2: IIP trends
(%)
(%)
10.0
6.0
9.1
5.1
8.8
9.0
5.0
4.4
4.3
8.0
7.9
4.2
7.6
7.5
8.0
7.3
7.2
4.0
3.5
7.0
3.2
2.9
7.0
6.1
6.1
3.0
2.4
5.7
6.0
2.0
1.2
0.9
5.0
1.0
4.0
-
3.0
(1.0)
(0.2)
Source: CSO, Angel Research
Source: MOSPI, Angel Research
Exhibit 3: Monthly CPI inflation trends
Exhibit 4: Manufacturing and services PMI
56.0
Mfg. PMI
Services PMI
(%)
4.5
4.2
54.0
3.9
4.0
3.6
3.7
3.4
3.4
52.0
3.2
3.3
3.5
3.0
50.0
3.0
2.4
2.2
48.0
2.5
2.0
46.0
1.5
1.5
44.0
1.0
42.0
0.5
40.0
-
Source: Market, Angel Research; Note: Level above 50 indicates expansion
Source: MOSPI, Angel Research
Exhibit 5: Exports and imports growth trends
Exhibit 6: Key policy rates
(%)
Exports yoy growth
Imports yoy growth
(%)
Repo rate
Reverse Repo rate
CRR
60.0
6.50
50.0
6.00
5.50
40.0
5.00
30.0
4.50
20.0
4.00
10.0
3.50
0.0
3.00
Source: Bloomberg, Angel Research
Source: RBI, Angel Research
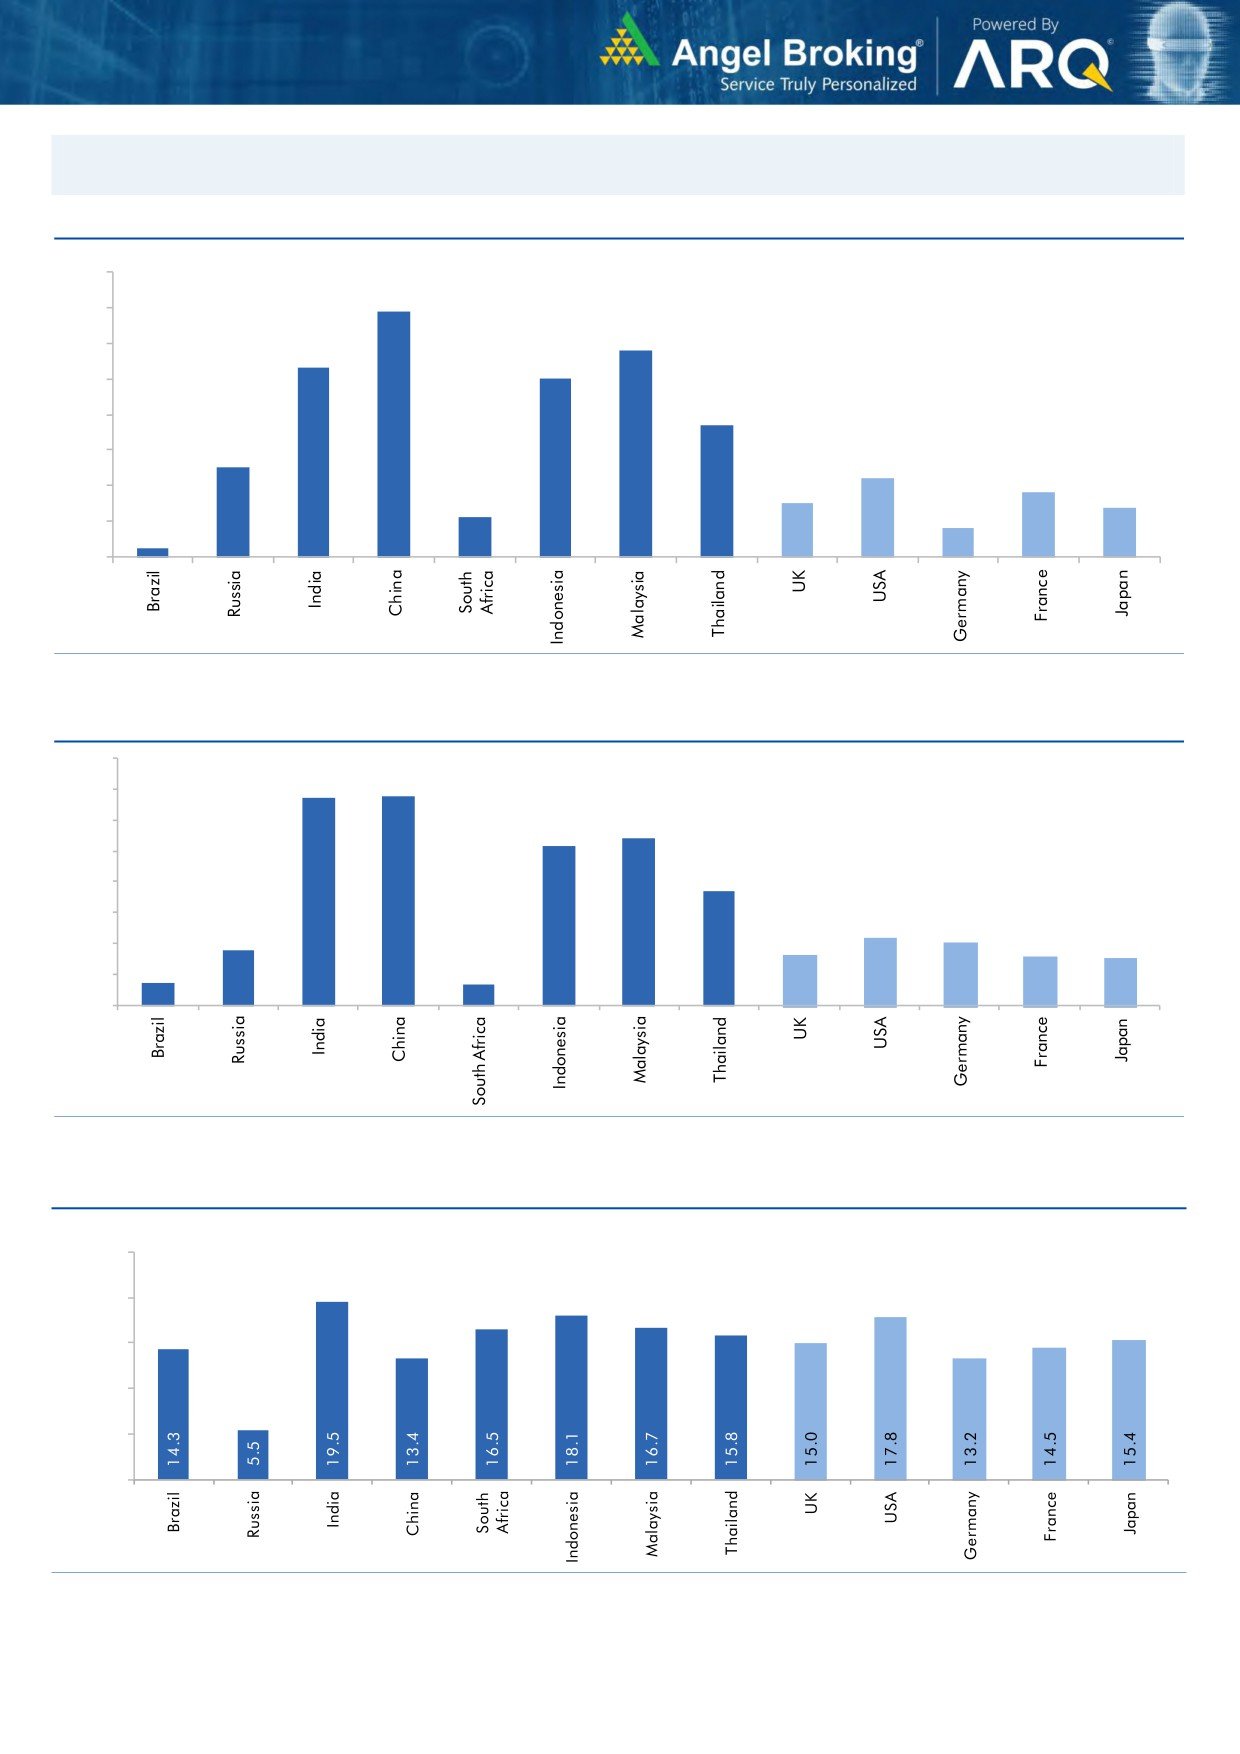
Market Outlook
October 23, 2017
Global watch
Exhibit 1: Latest quarterly GDP Growth (%, yoy) across select developing and developed countries
(%)
8.0
6.9
7.0
5.8
6.0
5.3
5.0
5.0
1.1
3.7
4.0
2.5
3.0
2.2
1.8
2.0
1.5
1.4
0.8
1.0
0.3
-
Source: Bloomberg, Angel Research
Exhibit 2: 2017 GDP Growth projection by IMF (%, yoy) across select developing and developed countries
(%)
6.7
6.8
7.0
6.0
5.4
5.2
5.0
3.7
4.0
3.0
1.8
2.2
2.0
1.7
1.6
2.0
0.7
1.5
0.7
1.0
-
Source: IMF, Angel Research
Exhibit 3: One year forward P-E ratio across select developing and developed countries
(x)
25.0
20.0
15.0
10.0
5.0
-
Source: IMF, Angel Research
Market Outlook
October 23, 2017
Exhibit 4: Relative performance of indices across globe
Returns (%)
Country
Name of index
Closing price
1M
3M
1YR
Brazil
Bovespa
76,391
0.5
17.6
19.8
Russia
Micex
2,072
0.7
7.3
5.6
India
Nifty
10,147
(0.1)
3.3
16.9
China
Shanghai Composite
3,379
0.3
6.1
10.4
South Africa
Top 40
51,601
3.7
7.7
15.8
Mexico
Mexbol
49,989
(0.7)
(3.2)
3.2
Indonesia
LQ45
984
0.8
1.5
6.2
Malaysia
KLCI
1,741
(2.4)
(0.8)
4.4
Thailand
SET 50
1,079
0.3
7.9
19.0
USA
Dow Jones
23,329
4.1
8.1
28.6
UK
FTSE
7,523
3.5
0.9
7.7
Japan
Nikkei
21,458
5.7
7.2
27.3
Germany
DAX
12,991
3.4
6.1
21.3
France
CAC
5,372
2.5
4.8
18.1
Source: Bloomberg, Angel Research, p68in4
Stock Watch
October 23, 2017
Company Name
Reco
CMP
Target
Mkt Cap
Sales ( Čcr )
OPM(%)
EPS (Č)
PER(x)
P/BV(x)
RoE(%)
EV/Sales(x)
(Č)
Price ( Č)
( Č cr )
FY18E FY19E
FY18E
FY19E
FY18E
FY19E
FY18E
FY19E
FY18E
FY19E
FY18E
FY19E
FY18E
FY19E
Agri / Agri Chemical
Rallis
Reduce
234
209
4,553
1,873
2,099
15.0
15.0
9.5
10.5
24.7
22.3
3.7
3.4
15.8
16.0
2.3
2.1
United Phosphorus
Neutral
789
-
40,087
18,922
21,949
18.0
18.5
36.2
45.6
21.8
17.3
4.6
3.8
22.7
23.8
2.3
1.9
Auto & Auto Ancillary
Ashok Leyland
Neutral
131
-
38,191
23,339
27,240
10.1
10.8
4.7
6.2
28.1
21.0
5.6
4.9
20.0
23.6
1.6
1.3
Bajaj Auto
Neutral
3,232
-
93,519
23,936
27,955
19.5
20.1
142.7
167.3
22.6
19.3
4.9
4.4
21.8
22.8
3.5
2.9
Bharat Forge
Buy
629
875
29,283
7,637
8,755
21.7
23.2
36.1
47.3
17.4
13.3
3.1
2.7
18.5
20.8
3.7
3.1
Eicher Motors
Neutral
31,521
-
85,809
19,043
22,837
19.5
19.9
835.4
1,019.0
37.7
30.9
14.1
10.9
40.9
37.8
4.4
3.6
Gabriel India
Neutral
199
-
2,859
1,782
2,033
9.7
10.2
7.1
8.9
28.0
22.5
5.7
4.8
21.0
22.2
1.6
1.3
Hero Motocorp
Accumulate
3,748
4,129
74,842
32,239
36,878
16.0
15.6
184.4
206.5
20.3
18.2
6.4
5.6
31.3
30.7
2.1
1.8
Jamna Auto Industries Neutral
58
-
2,311
1,441
1,662
14.4
14.8
13.9
17.6
4.2
3.3
1.1
0.9
30.0
31.0
1.6
1.4
Mahindra and Mahindra Neutral
1,371
-
85,170
46,971
53,816
13.6
14.0
67.7
79.8
20.3
17.2
2.9
2.6
15.0
15.9
1.7
1.4
Maruti
Accumulate
7,790
8,658
235,308
81,825
101,245
15.0
15.0
283.5
356.0
27.5
21.9
6.0
4.9
21.9
22.4
2.5
2.0
Minda Industries
Neutral
838
-
7,242
4,328
5,084
11.0
11.9
27.3
36.4
30.8
23.0
6.5
5.1
23.1
25.6
1.8
1.5
Motherson Sumi
Neutral
355
-
74,828
55,937
64,445
10.8
11.4
16.9
21.1
21.0
16.9
4.7
4.8
25.2
25.4
1.4
1.2
Tata Motors
Neutral
434
-
125,181
303,167
343,649
11.8
13.8
33.1
54.7
13.1
7.9
2.1
1.7
16.9
23.0
0.5
0.4
TVS Motor
Neutral
690
-
32,783
13,992
16,216
9.0
9.4
17.1
20.3
40.5
34.0
10.7
8.3
29.7
27.7
2.3
1.9
Amara Raja Batteries
Buy
684
858
11,677
6,140
7,122
14.3
15.6
29.3
39.0
23.3
17.5
4.0
3.3
17.1
19.0
1.9
1.6
Exide Industries
Neutral
208
-
17,718
8,689
9,854
15.1
15.2
9.7
11.0
21.6
19.0
3.8
3.4
15.7
16.1
1.8
1.5
Apollo Tyres
Neutral
244
-
12,395
15,739
17,326
13.3
14.6
20.4
26.7
11.9
9.1
1.5
1.3
20.4
26.7
1.0
0.9
Ceat
Neutral
1,727
-
6,985
6,661
7,717
11.1
14.2
116.2
178.2
14.9
9.7
2.6
2.1
15.2
21.3
1.2
1.0
JK Tyres
Neutral
149
-
3,380
8,318
9,239
16.2
16.4
21.0
27.5
7.1
5.4
1.4
1.1
19.1
20.4
0.9
0.7
Swaraj Engines
Neutral
2,029
-
2,520
788
889
16.4
16.5
71.6
81.0
28.3
25.1
8.2
7.6
29.6
31.0
2.9
2.5
Subros
Neutral
257
-
1,539
1,855
2,135
11.6
11.8
10.3
14.7
25.0
17.5
3.8
3.3
15.8
19.1
1.0
0.9
Capital Goods
BEML
Neutral
1,732
-
7,215
4,286
5,194
7.1
8.2
42.9
58.1
40.4
29.8
3.3
3.0
7.6
8.7
1.7
1.4
Bharat Electronics
Neutral
173
-
42,420
10,258
12,470
19.6
19.5
7.3
8.6
23.7
20.1
0.5
0.4
20.4
21.9
3.6
2.9
Voltas
Neutral
539
-
17,823
6,778
8,004
9.6
11.0
17.1
22.4
31.5
24.1
7.5
6.6
17.7
19.8
2.3
2.0
BHEL
Neutral
85
-
31,097
33,200
39,167
6.8
9.5
6.2
11.2
13.7
7.6
0.6
0.6
4.6
8.0
0.5
0.4
Blue Star
Accumulate
799
867
7,649
5,220
6,207
6.3
6.6
16.8
22.3
47.5
35.8
9.4
8.3
19.9
23.3
1.4
1.2
CG Power and Industrial
Neutral
82
-
5,136
6,555
7,292
7.5
7.5
-
0.8
8,195.0
102.4
1.3
1.3
0.1
1.2
0.9
0.8
Solutions
Greaves Cotton
Neutral
129
-
3,160
1,778
1,993
14.7
15.1
8.1
9.1
16.0
14.2
3.6
3.4
21.8
23.6
1.5
1.4
Stock Watch
October 23, 2017
Company Name
Reco
CMP
Target
Mkt Cap
Sales ( Čcr )
OPM(%)
EPS (Č)
PER(x)
P/BV(x)
RoE(%)
EV/Sales(x)
(Č)
Price ( Č)
( Č cr )
FY18E FY19E
FY18E
FY19E
FY18E
FY19E
FY18E
FY19E
FY18E
FY19E
FY18E
FY19E
FY18E
FY19E
Capital Goods
KEC International
Buy
297
350
7,645
9,779
11,113
9.4
9.8
14.2
18.2
20.9
16.3
4.0
3.3
21.1
22.1
1.0
0.9
KEI Industries
Buy
323
380
2,512
3,001
3,391
10.0
10.0
13.0
16.1
24.8
20.0
4.5
3.7
18.2
18.7
1.0
0.9
Thermax
Neutral
977
-
11,637
4,125
4,747
10.3
10.8
26.7
31.5
36.6
31.0
4.1
3.7
11.2
12.0
2.6
2.2
VATech Wabag
Accumulate
593
681
3,239
3,867
4,126
9.6
10.0
34.9
39.8
17.0
14.9
2.8
2.4
17.7
17.5
0.9
0.8
Cement
ACC
Neutral
1,785
-
33,519
12,255
13,350
13.5
14.3
58.0
66.2
30.8
27.0
3.6
3.4
11.5
12.2
2.7
2.5
Ambuja Cements
Neutral
279
-
55,320
10,250
11,450
17.5
19.0
7.2
8.3
38.7
33.6
2.8
2.6
7.0
7.8
5.2
4.6
India Cements
Neutral
181
-
5,579
6,135
6,750
14.8
15.2
8.5
11.5
21.3
15.7
1.1
1.0
4.8
6.2
1.3
1.1
JK Cement
Neutral
954
-
6,669
4,150
4,775
19.2
20.0
49.0
63.5
19.5
15.0
3.1
2.7
17.0
18.5
2.0
1.7
J K Lakshmi Cement
Neutral
391
-
4,603
3,422
3,757
15.5
17.0
13.5
23.2
29.0
16.9
3.0
2.6
10.8
15.5
1.7
1.5
Orient Cement
Neutral
156
-
3,194
2,215
3,233
16.8
17.0
5.9
6.9
26.4
22.6
2.0
1.9
10.8
10.1
2.4
1.6
UltraTech Cement
Neutral
4,091
-
112,305
28,250
35,150
20.2
23.5
77.5
122.2
52.8
33.5
4.5
4.0
9.6
14.8
4.4
3.6
Construction
KNR Constructions
Neutral
213
-
2,991
1,846
2,203
14.5
14.5
12.1
13.7
17.6
15.6
1.0
0.8
17.5
16.7
1.7
1.4
Larsen & Toubro
Neutral
1,141
-
159,830
95,787
109,476
10.2
11.6
44.5
50.8
25.7
22.5
3.2
3.0
12.9
13.1
2.2
2.0
Gujarat Pipavav Port
Neutral
140
-
6,780
739
842
61.6
62.7
5.1
6.2
27.5
22.8
3.4
3.3
12.7
14.9
8.6
7.5
PNC Infratech
Neutral
157
-
4,021
2,040
2,935
13.0
13.0
6.4
9.0
24.5
17.4
0.6
0.6
9.7
12.2
2.0
1.4
Simplex Infra
Neutral
460
-
2,275
6,012
6,619
11.6
11.7
21.1
31.0
21.9
14.9
1.5
1.4
6.5
8.6
0.9
0.8
Sadbhav Engineering
Accumulate
279
298
4,779
3,823
4,426
10.7
10.8
10.3
11.8
27.0
23.6
3.2
2.8
10.1
10.5
1.6
1.4
NBCC
Neutral
251
-
22,617
9,099
12,706
6.4
6.4
7.3
9.6
34.5
26.3
1.5
1.2
27.5
30.5
2.3
1.7
MEP Infra
Neutral
97
-
1,584
2,403
2,910
18.3
16.8
2.4
6.1
41.4
16.0
15.7
10.6
35.2
55.8
1.8
1.5
SIPL
Neutral
97
-
3,401
2,060
2,390
46.8
47.7
(5.8)
(3.1)
3.6
4.1
(14.2)
(2.3)
6.4
6.0
Engineers India
Neutral
150
-
10,091
1,795
2,611
21.1
22.4
5.9
8.1
25.4
18.5
1.8
1.8
12.9
16.1
4.0
2.6
Financials
Axis Bank
Buy
464
580
111,332
32,558
35,843
3.5
3.2
27.8
41.0
16.7
11.3
1.8
1.6
11.4
14.9
-
-
Bank of Baroda
Neutral
137
-
31,521
22,533
26,079
2.4
2.4
12.0
20.9
11.4
6.6
0.7
0.7
6.6
11.0
-
-
Canara Bank
Neutral
305
-
18,214
17,925
20,235
2.0
2.1
18.5
36.5
16.5
8.4
0.6
0.6
3.4
6.2
-
-
Can Fin Homes
Buy
541
2,128
7,197
586
741
3.5
3.5
107.8
141.0
5.0
3.8
1.1
0.9
24.1
25.6
-
-
Cholamandalam Inv. &
Accumulate
1,129
1,230
17,648
2,826
3,307
6.3
6.3
53.7
64.6
21.1
17.5
3.6
3.1
18.3
18.9
-
-
Fin. Co.
Dewan Housing Finance Accumulate
603
670
18,891
2,676
3,383
2.4
2.7
37.4
49.7
16.1
12.1
2.1
1.9
13.8
16.2
-
-
Equitas Holdings
Buy
154
235
5,228
1,125
1,380
9.6
9.8
1.5
6.0
102.9
25.7
2.3
2.2
2.4
8.2
-
-
Federal Bank
Neutral
126
-
24,614
4,896
5,930
2.8
3.1
5.4
7.6
23.5
16.7
2.0
1.8
8.5
11.0
-
-
Stock Watch
October 23, 2017
Company Name
Reco
CMP
Target
Mkt Cap
Sales ( Čcr )
OPM(%)
EPS (Č)
PER(x)
P/BV(x)
RoE(%)
EV/Sales(x)
(Č)
Price ( Č)
( Č cr )
FY18E FY19E
FY18E
FY19E
FY18E
FY19E
FY18E
FY19E
FY18E
FY19E
FY18E
FY19E
FY18E
FY19E
Financials
GIC Housing
Buy
506
655
2,722
376
477
3.6
3.7
33.0
40.0
15.3
12.6
2.8
2.3
20.0
23.0
-
-
HDFC Bank
Neutral
1,870
-
482,617
55,236
63,253
4.5
4.4
68.9
82.4
27.2
22.7
4.7
3.9
18.7
18.5
-
-
ICICI Bank
Buy
263
315
168,777
42,361
51,378
3.6
3.9
18.4
25.7
14.3
10.2
1.6
1.5
11.3
15.0
-
-
Karur Vysya Bank
Buy
124
180
7,515
3,289
3,630
3.7
3.9
10.8
14.1
11.5
8.8
1.4
1.2
12.5
14.7
-
-
LIC Housing Finance
Neutral
669
-
33,762
4,895
6,332
3.4
3.7
50.7
66.8
13.2
10.0
2.6
2.2
21.7
23.8
-
-
Punjab Natl.Bank
Neutral
131
-
27,834
23,708
25,758
2.1
2.1
5.9
16.4
22.3
8.0
0.7
0.6
3.0
8.3
-
-
RBL Bank
Neutral
523
-
21,590
2,309
2,888
2.6
2.5
16.4
19.1
31.9
27.4
4.0
3.6
13.3
13.8
-
-
Repco Home Finance
Buy
654
825
4,091
496
597
4.4
4.2
38.5
48.7
17.0
13.4
3.1
2.5
19.6
20.6
-
-
South Ind.Bank
Neutral
32
-
5,792
3,195
3,567
3.0
3.1
3.0
3.8
10.6
8.4
1.1
0.9
10.5
11.9
-
-
St Bk of India
Neutral
244
-
210,795
105,827
121,056
2.4
2.5
16.1
25.6
15.2
9.6
1.2
1.1
6.6
9.9
-
-
Union Bank
Neutral
126
-
9,153
14,650
16,225
2.3
2.3
23.1
32.5
5.5
3.9
0.4
0.4
7.1
9.2
-
-
Yes Bank
Neutral
362
-
82,972
11,088
13,138
3.0
2.9
84.0
99.3
4.3
3.7
0.7
0.6
16.3
16.8
-
-
FMCG
Akzo Nobel India
Neutral
1,810
-
8,681
3,164
3,607
13.8
13.7
58.6
67.9
30.9
26.6
7.6
6.7
24.5
25.1
2.6
2.3
Asian Paints
Neutral
1,180
-
113,185
17,603
20,615
18.6
18.6
2,128.9
2,543.3
0.6
0.5
11.7
9.8
28.0
28.9
6.2
5.2
Britannia
Neutral
4,675
-
56,127
9,690
11,278
14.8
15.4
84.0
101.0
55.7
46.3
20.3
16.1
40.6
39.0
5.8
4.9
Colgate
Neutral
1,053
-
28,648
4,420
5,074
24.9
25.3
28.6
32.8
36.8
32.1
14.5
11.7
43.8
40.5
6.2
5.4
Dabur India
Neutral
319
-
56,113
8,346
9,344
19.6
19.9
7.8
9.0
40.8
35.4
8.2
7.4
25.2
24.8
6.3
5.6
GlaxoSmith Con*
Neutral
4,922
-
20,700
5,072
5,760
18.2
18.4
176.3
199.2
27.9
24.7
5.9
5.4
21.2
21.7
3.4
2.9
Godrej Consumer
Neutral
963
-
65,632
10,171
11,682
20.8
21.5
21.7
27.1
44.4
35.6
10.0
8.6
22.3
23.4
6.6
5.7
HUL
Neutral
1,264
-
273,633
37,077
41,508
20.3
21.8
5,189.9
6,318.5
0.2
0.2
38.5
32.9
74.8
82.0
7.2
6.5
ITC
Neutral
270
-
329,295
44,588
49,853
37.0
37.3
9.6
11.0
28.2
24.6
6.9
6.6
25.1
27.3
6.9
6.1
Marico
Neutral
317
-
40,863
6,788
7,766
18.5
19.2
7.1
8.5
44.6
37.3
15.6
13.4
36.9
38.0
5.9
5.1
Nestle*
Neutral
7,250
-
69,899
10,083
11,182
20.0
20.9
119.7
141.3
60.6
51.3
213.5
195.1
36.7
39.8
6.6
5.9
Tata Global
Neutral
207
-
13,045
7,121
7,641
11.9
12.3
6.9
8.0
30.0
25.8
2.0
1.9
6.8
7.2
1.6
1.5
Procter & Gamble
Neutral
8,606
-
27,935
3,034
3,579
27.1
27.7
167.7
198.8
51.3
43.3
13.8
11.9
28.8
29.5
8.6
7.2
Hygiene
IT
HCL Tech^
Accumulate
923
1,014
131,768
52,342
57,053
20.9
20.9
62.8
67.6
14.7
13.7
3.3
2.8
22.4
20.6
2.2
1.9
Infosys
Buy
924
1,179
212,343
73,963
80,619
26.0
26.0
64.4
69.3
14.4
13.3
2.8
2.6
19.7
19.6
2.3
2.1
TCS
Neutral
2,589
-
510,154
127,403
138,870
27.6
27.6
144.5
156.0
17.9
16.6
5.3
5.0
29.7
29.8
3.7
3.3
Tech Mahindra
Buy
459
533
44,740
31,015
33,496
15.0
15.0
35.6
38.1
12.9
12.0
2.2
2.1
17.0
16.3
1.2
1.1
Stock Watch
October 23, 2017
Company Name
Reco
CMP
Target
Mkt Cap
Sales ( Čcr )
OPM(%)
EPS (Č)
PER(x)
P/BV(x)
RoE(%)
EV/Sales(x)
(Č)
Price ( Č)
( Č cr )
FY18E FY19E
FY18E
FY19E
FY18E
FY19E
FY18E
FY19E
FY18E
FY19E
FY18E
FY19E
FY18E
FY19E
IT
Wipro
Neutral
295
-
143,592
58,536
61,858
20.3
20.3
18.2
19.1
16.2
15.5
2.5
2.2
14.6
13.4
2.4
2.3
Media
D B Corp
Neutral
369
-
6,789
2,404
2,625
30.5
31.5
23.7
26.9
15.6
13.7
3.7
3.1
23.5
22.8
2.7
2.4
HT Media
Neutral
101
-
2,361
2,589
2,830
15.1
15.4
8.3
10.9
12.2
9.3
1.0
0.9
8.4
10.4
0.5
0.3
Jagran Prakashan
Buy
174
225
5,700
2,541
2,835
28.5
28.7
12.7
14.1
13.7
12.4
2.9
2.5
21.3
21.4
2.1
1.8
Sun TV Network
Neutral
814
-
32,073
3,238
3,789
51.9
55.1
30.9
38.0
26.3
21.4
7.5
6.6
30.0
31.0
9.4
7.9
Hindustan Media
Neutral
245
-
1,796
1,002
1,074
23.3
23.5
29.2
33.8
8.4
7.2
1.3
1.1
15.6
15.4
0.8
0.5
Ventures
TV Today Network
Buy
352
435
2,102
667
727
27.7
27.7
18.6
20.1
19.0
17.6
3.0
3.0
15.6
17.3
2.7
2.5
Music Broadcast Limited Accumulate
385
434
2,195
271
317
91.0
109.0
6.0
10.0
64.1
38.5
4.0
3.6
6.5
9.3
7.7
6.3
Metals & Mining
Coal India
Neutral
290
-
180,139
82,301
91,235
17.0
18.0
17.1
20.5
17.0
14.2
3.2
3.0
45.0
55.0
1.9
1.7
Hind. Zinc
Neutral
323
-
136,414
22,108
24,555
57.0
58.0
22.1
26.3
14.6
12.3
4.7
3.8
32.0
35.0
5.2
4.3
Hindalco
Neutral
275
-
61,778
102,350
105,355
13.5
14.5
21.5
24.5
12.8
11.2
1.8
1.5
15.0
15.2
1.2
1.1
JSW Steel
Neutral
259
-
62,521
64,500
68,245
21.1
21.5
20.1
21.2
12.9
12.2
2.4
2.0
-
-
1.7
1.6
NMDC
Neutral
122
-
38,742
10,209
11,450
47.0
48.0
11.1
12.1
11.0
10.1
1.5
1.4
-
-
3.3
3.0
SAIL
Neutral
60
-
24,615
54,100
63,555
3.0
10.0
(10.0)
1.5
39.7
0.8
0.8
-
-
1.5
1.2
Vedanta
Neutral
331
-
123,206
81,206
87,345
28.0
29.0
26.5
33.5
12.5
9.9
2.9
2.4
-
-
2.3
2.0
Tata Steel
Neutral
709
-
68,893
121,445
126,500
16.2
17.2
65.4
81.3
10.9
8.7
1.7
1.5
-
-
1.1
1.0
Oil & Gas
GAIL
Neutral
436
-
73,741
53,115
52,344
14.2
15.3
30.0
31.1
14.5
14.0
1.8
1.7
-
-
1.1
1.1
ONGC
Neutral
174
-
223,555
83,111
84,934
44.2
44.9
16.4
16.9
10.6
10.3
1.3
1.2
-
-
2.6
2.5
Indian Oil Corp
Neutral
412
-
199,869
396,116
432,560
8.5
8.8
40.1
42.2
10.3
9.8
1.8
1.6
-
-
0.6
0.6
Reliance Industries
Neutral
914
-
594,285
257,711
267,438
17.0
18.2
89.1
89.5
10.3
10.2
1.0
0.9
-
-
2.0
1.9
Pharmaceuticals
Alembic Pharma
Buy
499
600
9,404
3,903
4,584
18.2
19.2
21.8
27.2
22.9
18.3
4.2
3.5
19.8
20.6
2.4
2.1
Alkem Laboratories Ltd
Accumulate
1,828
2,079
21,856
6,320
7,341
17.5
19.8
72.7
96.6
25.1
18.9
4.5
3.8
16.7
18.7
3.4
2.9
Aurobindo Pharma
Accumulate
757
823
44,366
17,086
19,478
22.1
22.0
44.7
51.4
16.9
14.7
3.8
3.0
24.7
22.7
2.7
2.4
Aventis*
Neutral
4,210
-
9,696
2,508
2,862
16.8
16.8
139.9
153.8
30.1
27.4
4.4
3.5
23.5
25.8
3.5
2.9
Cadila Healthcare
Reduce
492
426
50,384
11,584
13,228
20.3
20.4
18.7
21.3
26.3
23.1
5.9
4.8
24.6
22.9
4.2
3.6
Cipla
Sell
611
458
49,142
16,619
19,437
15.4
16.2
19.7
24.3
31.0
25.1
3.5
3.1
12.0
13.2
3.1
2.6
Dr Reddy's
Neutral
2,385
-
39,537
15,844
17,973
17.6
18.2
91.7
111.0
26.0
21.5
3.0
2.7
11.9
13.0
2.7
2.4
GSK Pharma*
Neutral
2,443
-
20,695
3,260
3,651
15.0
18.0
46.1
58.6
53.0
41.7
10.9
11.2
20.0
26.5
6.2
5.7
Indoco Remedies
Sell
246
153
2,262
1,154
1,310
14.9
14.9
11.3
12.7
21.7
19.3
3.1
2.7
15.0
15.0
2.1
1.8
Stock Watch
October 23, 2017
Company Name
Reco
CMP
Target
Mkt Cap
Sales ( Čcr )
OPM(%)
EPS (Č)
PER(x)
P/BV(x)
RoE(%)
EV/Sales(x)
(Č)
Price ( Č)
( Č cr )
FY18E FY19E
FY18E
FY19E
FY18E
FY19E
FY18E
FY19E
FY18E
FY19E
FY18E
FY19E
FY18E
FY19E
Pharmaceuticals
Ipca labs
Accumulate
494
540
6,228
3,593
4,022
14.5
15.5
19.4
25.2
25.4
19.6
2.3
2.1
9.5
11.2
1.8
1.6
Lupin
Buy
1,049
1,467
47,389
18,657
21,289
21.3
23.3
52.8
66.7
19.9
15.7
3.0
2.5
16.3
17.5
2.6
2.1
Natco Pharma
Accumulate
991
1,057
17,267
1,886
2,016
32.3
29.5
23.2
22.0
42.8
44.9
9.0
7.9
20.9
17.6
9.0
8.4
Sun Pharma
Neutral
540
-
129,643
32,899
36,451
26.9
25.4
31.6
32.3
17.1
16.7
3.0
2.6
18.7
18.8
3.6
3.1
Syngene International
Accumulate
502
557
10,030
1,402
1,823
32.8
36.0
15.9
20.7
31.6
24.3
5.9
4.9
18.7
20.0
7.1
5.5
Power
Tata Power
Neutral
82
-
22,152
32,547
33,806
20.5
20.5
4.7
5.4
17.4
15.3
1.7
1.4
10.5
10.5
1.7
1.6
NTPC
Neutral
178
-
146,769
86,070
101,246
28.3
30.7
12.9
16.2
13.8
11.0
1.4
1.3
10.6
12.4
3.1
2.8
Power Grid
Neutral
213
-
111,485
29,183
32,946
89.7
90.0
18.0
20.8
11.9
10.3
2.0
1.8
17.7
18.2
7.8
7.2
Real Estate
Prestige Estate
Neutral
282
-
10,583
4,607
5,146
21.0
22.2
7.9
9.8
35.7
28.8
2.2
2.0
10.3
12.0
3.5
3.2
MLIFE
Buy
448
522
2,299
487
590
12.3
17.8
21.0
31.2
21.3
14.4
1.1
1.1
5.2
7.4
3.4
2.8
Telecom
Bharti Airtel
Neutral
462
-
184,500
97,903
105,233
36.0
36.3
9.3
11.1
49.6
41.8
2.4
2.3
5.0
5.6
2.8
2.6
Idea Cellular
Neutral
89
-
31,975
35,012
37,689
27.1
27.7
(4.4)
(2.7)
1.4
1.4
(6.8)
(4.6)
2.2
2.0
zOthers
Abbott India
Neutral
4,157
-
8,833
3,244
3,723
14.9
16.1
167.5
209.4
24.8
19.9
5.5
4.6
23.7
24.8
2.4
2.0
Asian Granito
Accumulate
504
570
1,515
1,169
1,286
12.5
12.5
16.0
19.7
31.5
25.5
3.4
3.0
10.7
11.6
1.5
1.4
Bajaj Electricals
Neutral
418
-
4,247
4,646
5,301
6.7
7.6
16.1
22.3
26.0
18.8
4.2
3.6
16.4
19.2
0.9
0.8
Banco Products (India)
Neutral
220
-
1,571
1,530
1,695
13.2
12.7
19.0
20.0
11.6
11.0
1.9
1.6
0.2
0.2
0.9
104.1
Coffee Day Enterprises
Neutral
224
-
4,614
3,494
3,913
17.4
18.0
4.8
5.7
-
39.3
2.0
1.9
-
0.1
1.8
1.6
Ltd
Elecon Engineering
Neutral
68
-
762
171
201
15.0
16.2
36.0
43.0
1.9
1.6
0.2
0.2
0.1
0.1
3.8
3.2
Garware Wall Ropes
Neutral
893
-
1,954
928
1,003
15.2
15.2
39.4
43.2
22.6
20.7
3.7
3.2
16.5
15.4
2.0
1.8
Goodyear India*
Neutral
811
-
1,871
1,717
1,866
11.8
12.3
47.9
49.8
16.9
16.3
2.6
2.3
15.6
15.7
0.8
112.3
Hitachi
Neutral
2,553
-
6,941
2,355
2,715
10.3
10.8
49.0
60.9
52.1
41.9
12.2
9.6
0.2
0.2
3.0
2.6
HSIL
Neutral
439
-
3,173
2,240
2,670
14.6
15.0
17.0
22.0
25.8
20.0
2.1
2.0
0.1
0.1
1.6
1.3
Interglobe Aviation
Neutral
1,149
-
41,563
22,570
27,955
14.2
15.0
63.6
81.8
18.1
14.1
9.5
8.0
0.5
0.6
1.5
1.1
Jyothy Laboratories
Neutral
383
-
6,958
1,781
2,044
14.1
15.0
9.4
10.5
41.0
36.5
8.7
8.2
0.2
0.2
4.1
3.5
Linc Pen & Plastics
Neutral
246
-
364
420
462
9.3
9.3
15.3
17.1
16.1
14.4
2.7
2.8
16.9
19.5
0.9
0.8
M M Forgings
Neutral
831
-
1,003
542
642
20.1
21.0
41.6
56.8
20.0
14.6
2.8
2.3
0.1
0.2
2.3
2.0
Mirza International
Neutral
161
-
1,936
1,148
1,285
18.0
18.0
8.0
9.4
20.0
17.2
3.3
2.8
16.3
16.1
1.8
1.6
Navkar Corporation
Buy
194
265
2,771
561
617
41.5
41.5
11.5
12.7
16.9
15.3
1.8
1.6
10.5
10.4
5.6
4.9
Nilkamal
Neutral
1,654
-
2,468
2,317
2,525
11.4
11.1
96.0
105.0
17.2
15.8
2.9
2.6
0.2
0.2
1.0
0.9
Stock Watch
October 23, 2017
Company Name
Reco
CMP
Target Mkt Cap
Sales ( Čcr )
OPM(%)
EPS (Č)
PER(x)
P/BV(x)
RoE(%)
EV/Sales(x)
(Č)
Price ( Č)
( Č cr )
FY18E FY19E FY18E FY19E FY18E FY19E FY18E FY19E FY18E FY19E FY18E FY19E FY18E FY19E
zOthers
Parag Milk Foods
Neutral
269
-
2,263
1,987
2,379
7.6
9.0
12.4
18.3
21.7
14.7
3.1
2.7
8.2
13.2
1.3
1.1
Radico Khaitan
Neutral
212
-
2,822
1,811
1,992
13.2
13.2
8.1
8.8
26.2
24.1
2.6
2.9
10.1
12.0
1.9
1.7
Relaxo Footwears
Neutral
523
-
6,286
1,981
2,310
13.7
14.5
12.0
15.5
43.6
33.8
8.5
6.9
0.2
0.2
3.2
2.8
Siyaram Silk Mills
Accumulate
2,685
2,856
2,517
1,769
1,981
12.7
12.7
113.1
131.1
23.7
20.5
3.7
3.2
15.5
15.5
1.6
1.4
Styrolution ABS India* Neutral
1,028
-
1,808
1,800
1,980
8.0
8.1
42.0
46.2
24.5
22.3
2.7
2.4
0.1
0.1
1.1
1.0
Surya Roshni
Neutral
323
-
1,417
4,870
5,320
7.7
7.8
22.8
28.1
14.2
11.5
1.9
1.6
0.1
0.1
0.5
0.5
TVS Srichakra
Neutral
3,074
-
2,354
2,729
2,893
12.7
12.5
248.5
265.0
12.4
11.6
3.5
2.9
0.3
0.3
0.9
0.8
Visaka Industries
Neutral
705
-
1,119
1,104
1,214
12.1
12.6
31.0
37.9
22.7
18.6
2.8
2.5
0.1
0.1
1.2
1.1
VIP Industries
Accumulate
265
300
3,744
1,450
1,693
10.4
10.5
6.5
7.8
40.5
33.9
8.6
7.5
21.1
22.1
2.6
2.2
Navin Fluorine
Neutral
707
-
3,486
945
1,154
22.4
22.6
28.7
34.8
24.7
20.3
4.1
3.5
-
-
3.2
2.5
Source: Company, Angel Research; Note: *December year end; #September year end; &October year end; Price as on October 18, 2017
Market Outlook
October 23, 2017
Research Team Tel: 022 - 39357800
DISCLAIMER
Angel Broking Private Limited (hereinafter referred to as “Angel”) is a registered Member of National Stock Exchange of India
Limited,Bombay Stock Exchange Limited and Metropolitan Stock Exchange Limited. It is also registered as a Depository Participant with
CDSL and Portfolio Manager with SEBI. It also has registration with AMFI as a Mutual Fund Distributor. Angel Broking Private Limited is a
registered entity with SEBI for Research Analyst in terms of SEBI (Research Analyst) Regulations, 2014 vide registration number
INH000000164. Angel or its associates has not been debarred/ suspended by SEBI or any other regulatory authority for accessing
/dealing in securities Market. Angel or its associates/analyst has not received any compensation / managed or
co-managed public offering of securities of the company covered by Analyst during the past twelve months.
This document is solely for the personal information of the recipient, and must not be singularly used as the basis of any investment
decision. Nothing in this document should be construed as investment or financial advice. Each recipient of this document should make
such investigations as they deem necessary to arrive at an independent evaluation of an investment in the securities of the companies
referred to in this document (including the merits and risks involved), and should consult their own advisors to determine the merits and
risks of such an investment.
Reports based on technical and derivative analysis center on studying charts of a stock's price movement, outstanding positions and
trading volume, as opposed to focusing on a company's fundamentals and, as such, may not match with a report on a company's
fundamentals. Investors are advised to refer the Fundamental and Technical Research Reports available on our website to evaluate the
contrary view, if any.
The information in this document has been printed on the basis of publicly available information, internal data and other reliable
sources believed to be true, but we do not represent that it is accurate or complete and it should not be relied on as such, as this
document is for general guidance only. Angel Broking Pvt. Limited or any of its affiliates/ group companies shall not be in any way
responsible for any loss or damage that may arise to any person from any inadvertent error in the information contained in this report.
Angel Broking Pvt. Limited has not independently verified all the information contained within this document. Accordingly, we cannot
testify, nor make any representation or warranty, express or implied, to the accuracy, contents or data contained within this document.
While Angel Broking Pvt. Limited endeavors to update on a reasonable basis the information discussed in this material, there may be
regulatory, compliance, or other reasons that prevent us from doing so.
This document is being supplied to you solely for your information, and its contents, information or data may not be reproduced,
redistributed or passed on, directly or indirectly.
Neither Angel Broking Pvt. Limited, nor its directors, employees or affiliates shall be liable for any loss or damage that may arise from
or in connection with the use of this information.